1. Overview

1.1. Features
Main
Pythonic implementation of density functional theory
Customizable workflows and developer-friendly code
Minimal dependencies and large platform support
Comparable and reproducible calculations
Example notebooks showcasing educational usage
Functionals
- LDA
- GGA
- meta-GGA
- Libxc
- Thermal functionals
- Custom parameters
Potentials
- All-electron Coulomb
- Long-range Coulomb
- GTH
- Custom parameters
SCF
- Steepest descent
- Line minimization
- Conjugate gradient
- Customizable schemes
Orbitals
- Kohn-Sham
- Fermi
- Fermi-Löwdin
- Wannier
- SCDM
Properties
- Energy contributions
- Orbital properties
- Field properties
- Spin properties
SIC
- Fixed density SIC
- FLO-SIC
- PyCOM
- Arbitraty orbital SIC
Files
- XYZ
- TRAJ
- CUBE
- POSCAR
- PDB
- JSON
- HDF5
Visualization
- Molecules
- Orbitals
- Densities
- Grids
- Files
- Contours
- Brillouin zones
- Band structures
1.2. Workflow
The following code samples show the workflow of how a bandstructure of a silicon crystal can be created.
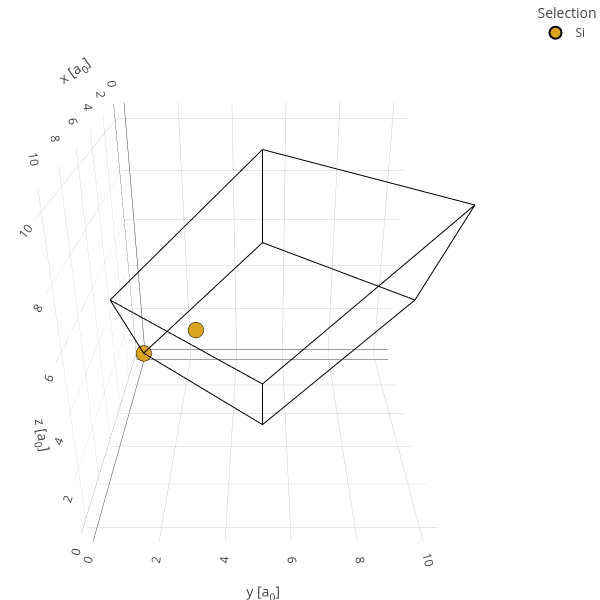
Create the unit cell and display it.
from eminus import Cell, SCF
from eminus.extras import plot_bandstructure

cell = Cell("Si", "diamond", ecut=10, a=10.2631, bands=8)
cell.view()

Run the DFT calculation.
scf = SCF(cell)
scf.run()
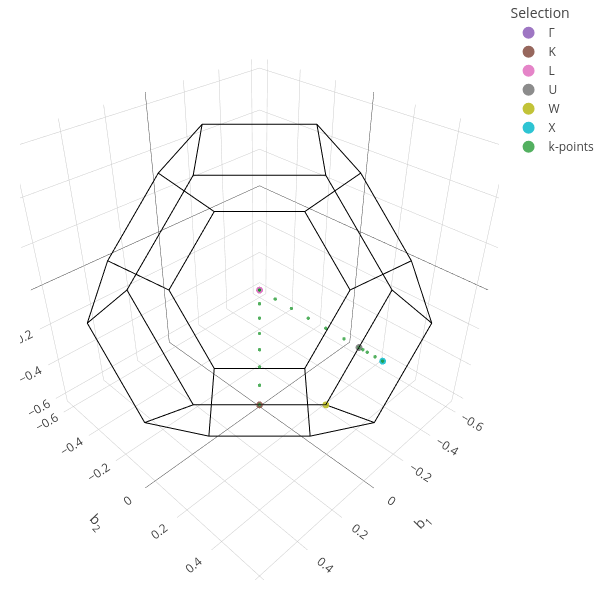
Define the band path and display the Brillouin zone.
scf.kpts.path = "LGXU,KG"
scf.kpts.Nk = 25
scf.kpts.build().view()

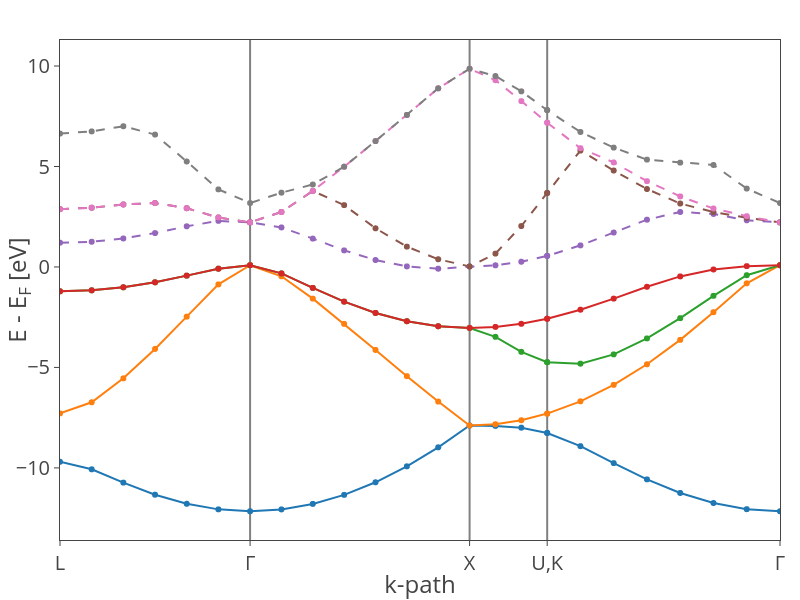
Calculate the eigenenergies and plot the band structure.
scf.converge_bands()
plot_bandstructure(scf)

Find this example with more comments in the examples section.